Week 4: WBS and Gantt Chart
Planning the architecture with a Work Breakdown Structure and Gantt chart before diving into development.
Before diving headfirst into wiring up microcontrollers and writing Python scripts, this week was all about hitting the brakes and actually planning the architecture. A sensor-fusion project like A.E.G.I.S. has a lot of moving parts, so I needed a solid roadmap to ensure I wouldn't get lost in the weeds later on.
Work Breakdown Structure (WBS)
To stop the project from feeling like one massive, impossible mountain, I built a Work Breakdown Structure (WBS). The idea here was to chop the entire A.E.G.I.S. system into bite-sized, logical modules.
I separated the workload into highly specific phases: initial Radio Frequency (RF) research, hardware procurement, embedded C development (for the ESP32 Wi-Fi tripwire), Python backend processing (the Wave-Shift math engine), and finally, the sensor fusion logic tying in the LD2410C radar. Mapping it out like this was a game-changer. It clearly highlighted the true scope of the project and gave me a tangible checklist to work through, rather than just blindly coding and hoping it all connects at the end.
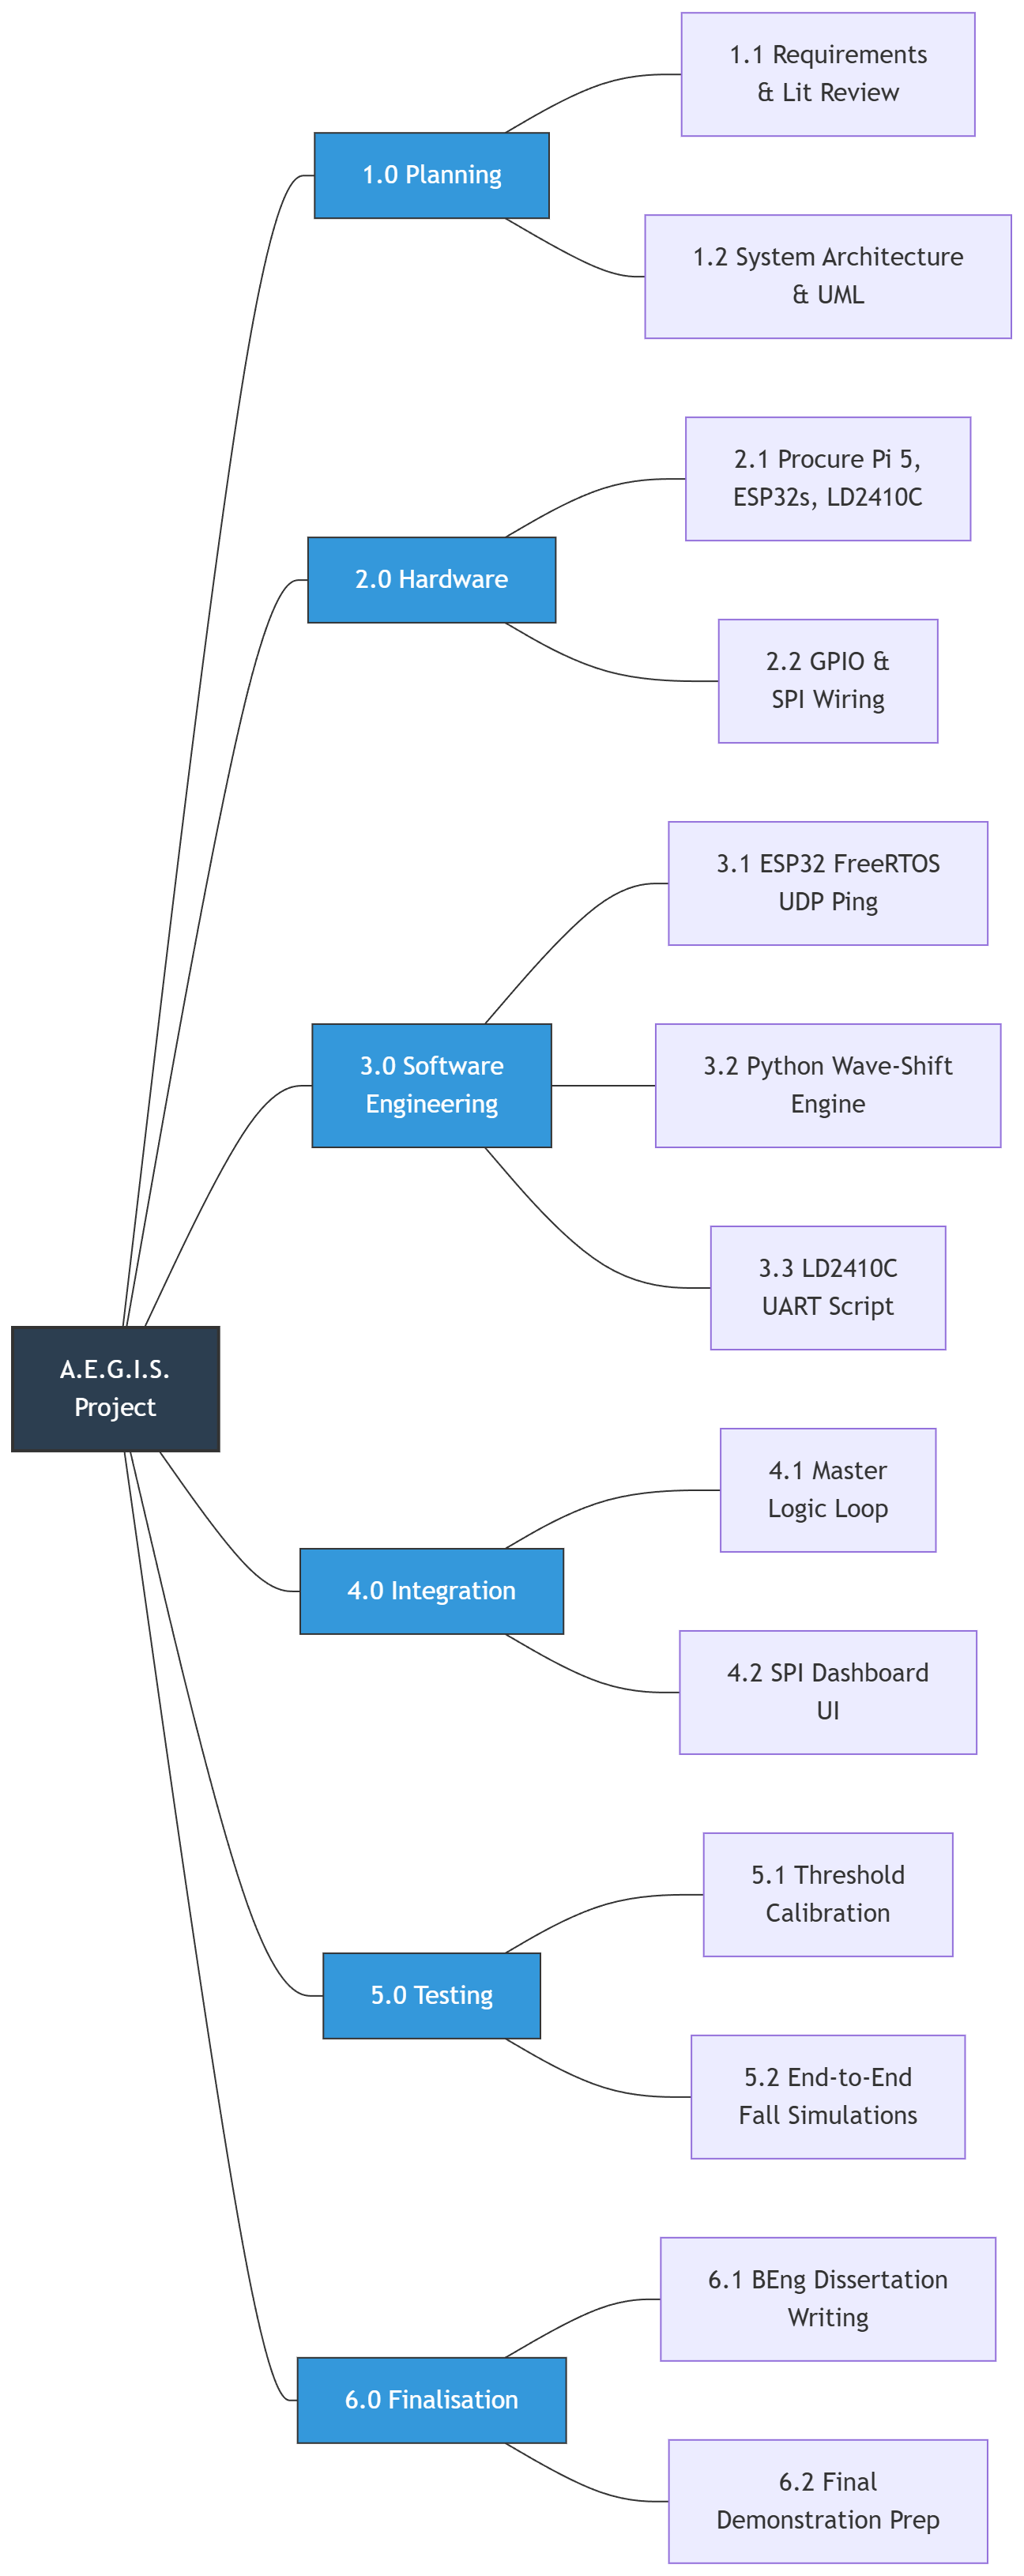 — Work Breakdown Structure
Gantt Chart
With the WBS outlining what needed to be done, I used a Gantt chart to map out when it would happen. Hardware and software projects are heavily dependent on sequence. For instance, I physically cannot calibrate the Python kinetic variance thresholds until the ESP32 network is successfully generating an autonomous Wi-Fi stream.
Plotting the tasks on a visual timeline helped me lock in strict dependencies and allocate specific weeks for coding, debugging, and physical testing. I used a timeline tool to visually stack the tasks leading up to the final submission in April. It gives me a clear sequence of deadlines and, most importantly, ensures I have enough buffer time for the inevitable troubleshooting that comes with custom hardware integration.
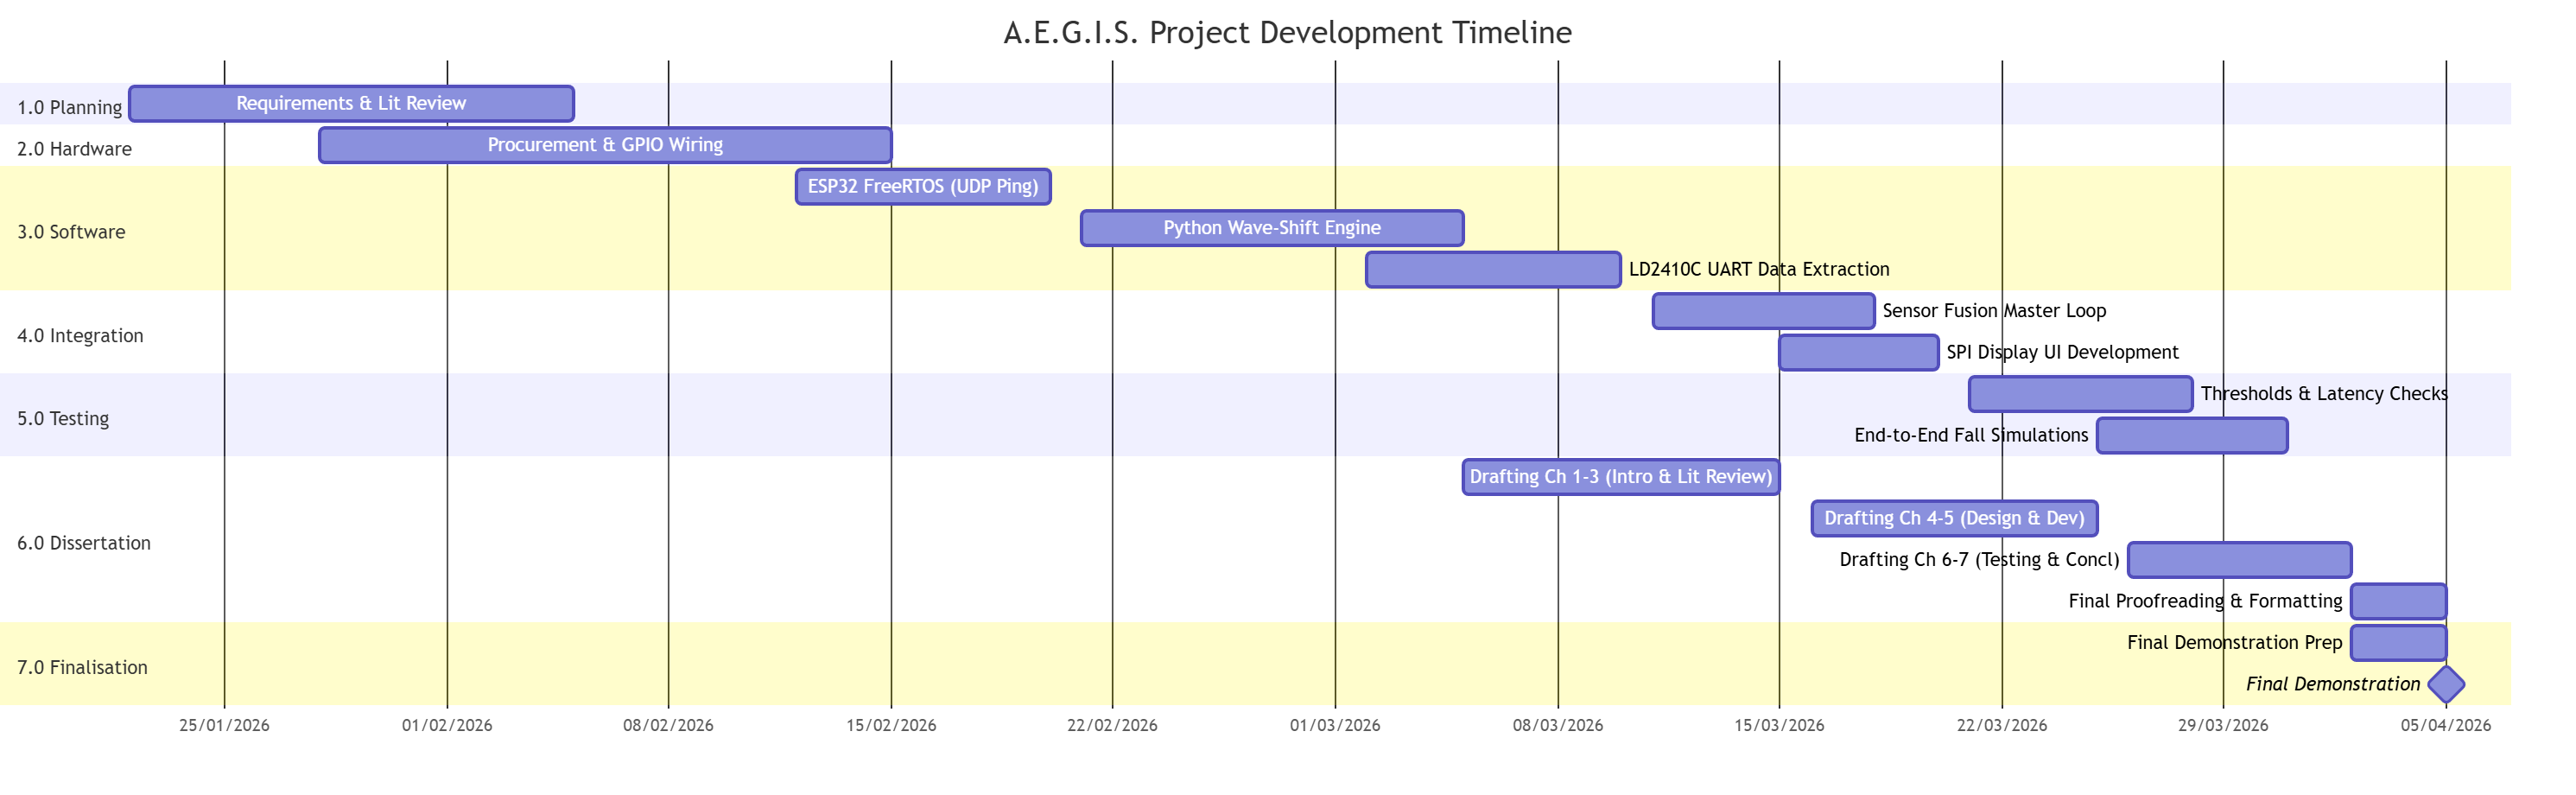 — Gantt Chart